

The Strait of Hormuz is one of the world’s most critical energy waterways, with approximately 25% of the global maritime oil trade flowing through the Strait. This infographic shows the top exporters and importers by country of crude oil and condensate (a liquid mixture of hydrocarbons related to the extraction of crude oil) flowing through the Strait of Hormuz.
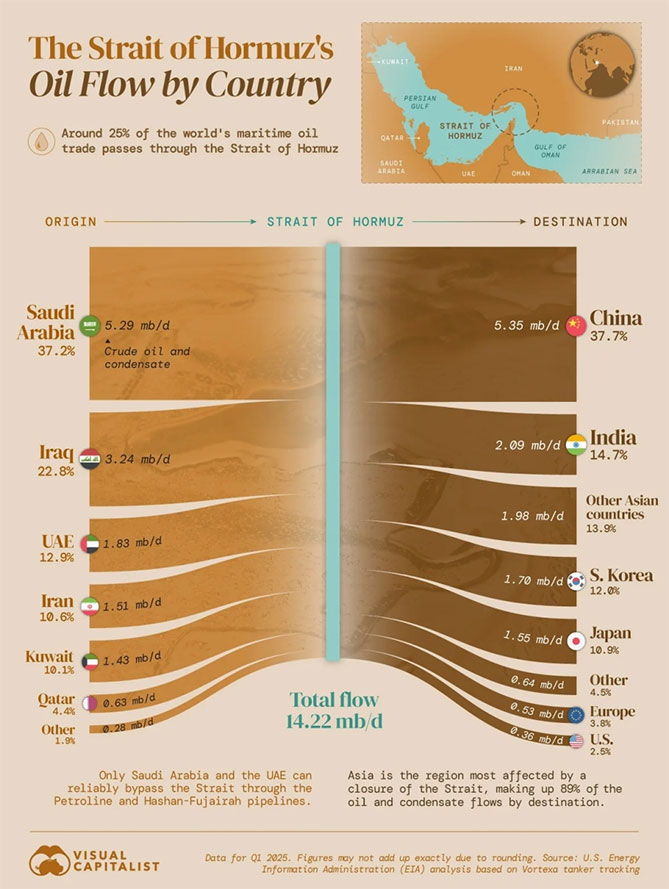
Countries exporting the most oil through the Strait of Hormuz
Oil flows through the Strait of Hormuz are heavily concentrated among a few Gulf producers. Saudi Arabia accounts for the largest share of crude and condensate exports transiting the Strait, at 37.2%. Iraq follows at 22.8%, with the United Arab Emirates at 12.9%, Iran at 10.6%, and Kuwait at 10.1% rounding out the top five exporters. Together, these five countries account for 93.6% of all crude and condensate volumes moving through the Strait.
This concentration underscores how closely global oil markets are tied to production in the Persian Gulf.
Countries importing the most oil from the Strait of Hormuz
On the demand side, Asia is overwhelmingly reliant on oil shipments through the Strait. Asian countries collectively receive 89.2% of the crude oil and condensate that transit the waterway. China alone accounts for 37.7% of total flows — more than any other country by a wide margin. India is the second-largest destination at 14.7%, followed by South Korea at 12.0% and Japan at 10.9%. Other Asian countries make up 13.9% of crude oil and condensate flows that pass through the Strait.
Together, China and India receive over half of all volumes passing through the waterway. In contrast, the United States receives just 2.5% of these flows, reflecting its increased domestic production and diversified import sources.
If you have questions, contact the Experts at Henssler Financial:
- Experts Request Form
- Email: experts@henssler.com
- Phone: 770-429-9166
Disclosure: The following information is reprinted with permission from Forefield, a division of Broadridge Financial Solutions, Inc. This article is for demonstrative and academic purposes and is meant to provide valuable background information on particular investments, NOT a recommendation to buy. The investments referenced within this article may currently be traded by Henssler Financial. All material presented is compiled from sources believed to be reliable and current, but accuracy cannot be guaranteed. The contents are intended for general information purposes only. Information provided should not be the sole basis in making any decisions and is not intended to replace the advice of a qualified professional, such as a tax consultant, insurance adviser or attorney. Although this material is designed to provide accurate and authoritative information with respect to the subject matter, it may not apply in all situations. Readers are urged to consult with their adviser concerning specific situations and questions. This is not to be construed as an offer to buy or sell any financial instruments. It is not our intention to state, indicate or imply in any manner that current or past results are indicative of future profitability or expectations. As with all investments, there are associated inherent risks. Please obtain and review all financial material carefully before investing. Henssler is not licensed to offer or sell insurance products, and this overview is not to be construed as an offer to purchase any insurance products. |